Use case
Interactive seating charts for websites
Let visitors explore your venue and pick their seats on the plan itself. Perfect for events, theatres, stadiums, conferences and classrooms.
Live demo: click the sections
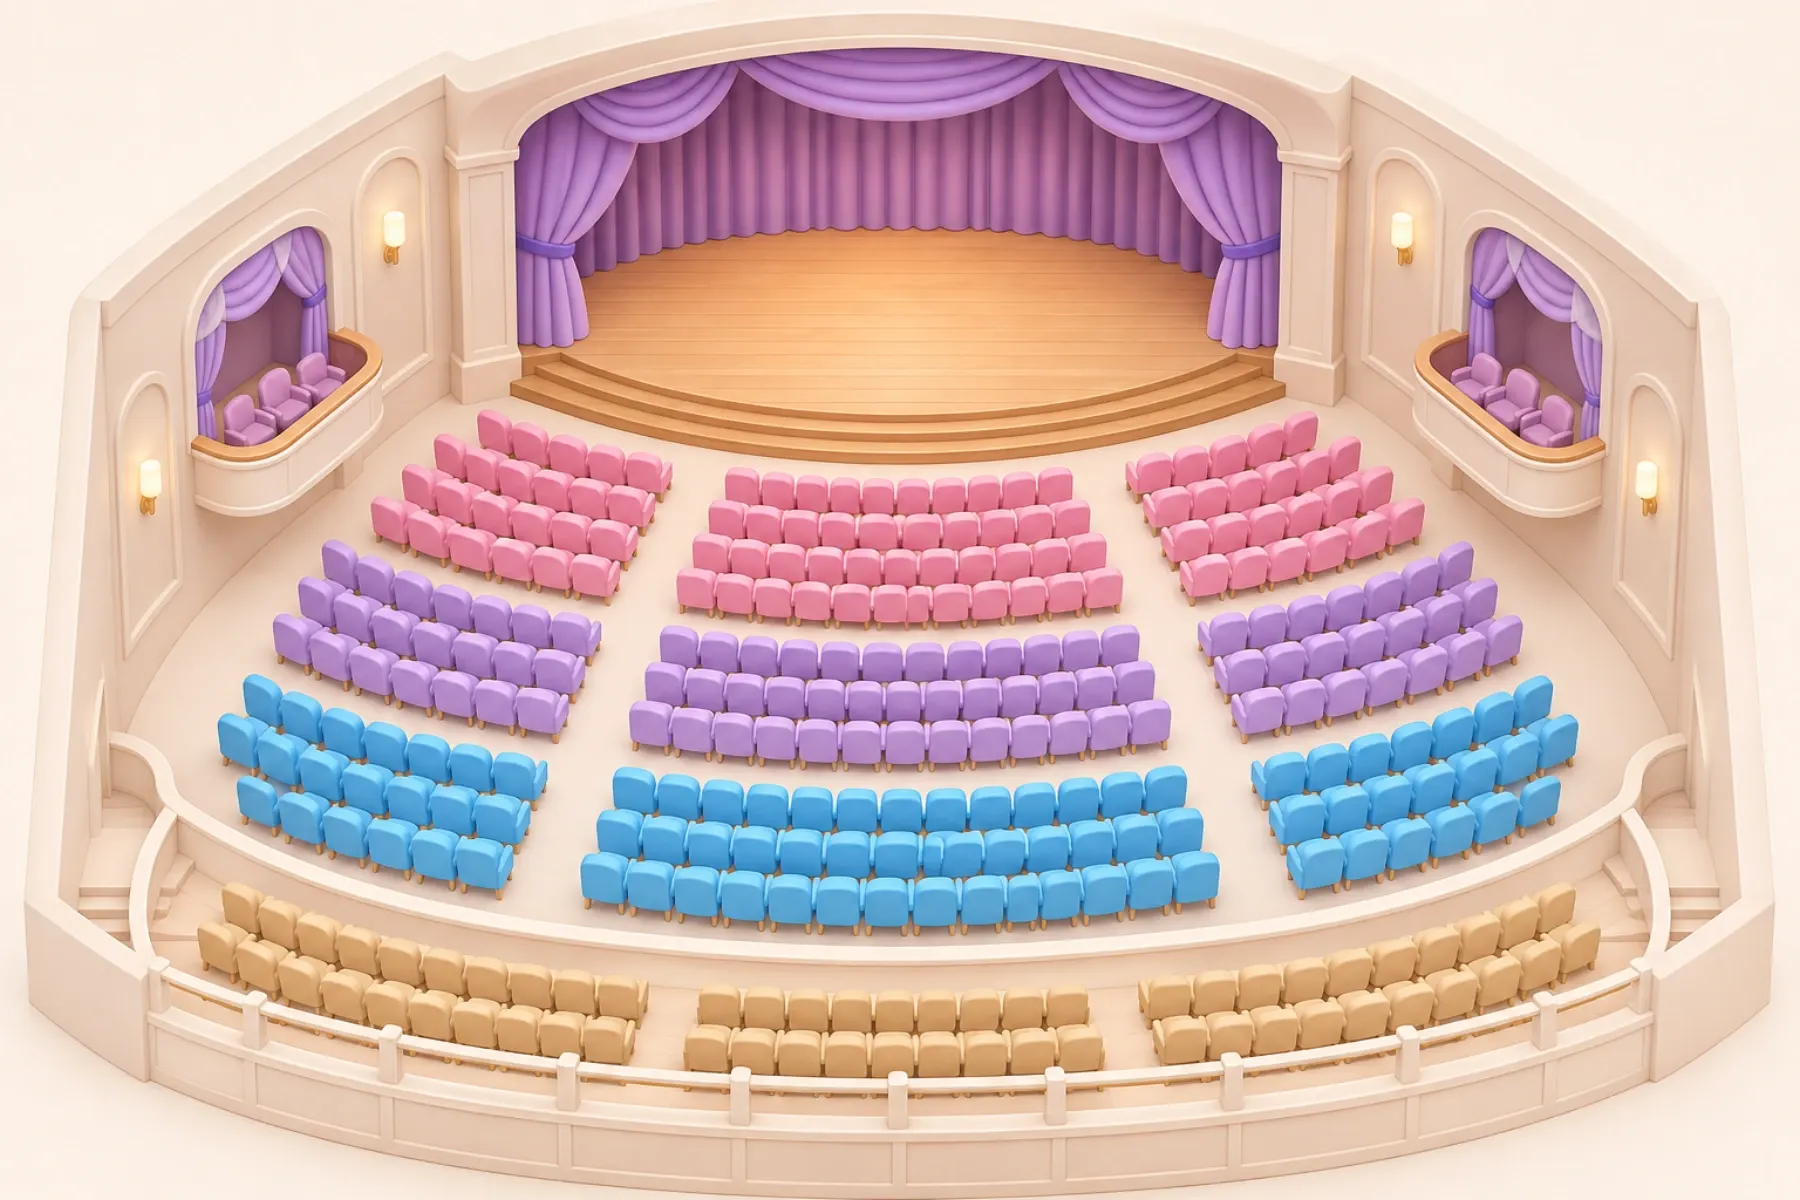
Why an interactive seating chart
A seating chart that visitors can click answers their questions before they ask: where is this section, what is the view like, what does a seat cost, which seats are accessible. That boosts satisfaction and shortens the path to the booking.
With interactive-img you turn any seating plan image into a clickable chart in minutes. Each section becomes a hotspot with its own title, description, picture and link, for example to your ticket shop.
How to create an interactive seating chart
- 1
Sign in and upload your seating plan
Log in to interactive-img and click New image to upload the seating plan as a picture. A clean export from your layout tool or a scanned plan both work.
- 2
Add a hotspot for each section
Click each section of the chart to place a hotspot and describe it: name, price range, view, capacity or accessibility notes. Add a link to the ticket page for that section.
- 3
Customise the appearance
Open the settings to match marker colours, sizes and the popup style to your brand.
- 4
Preview the chart
Use the preview to check how the chart behaves on desktop and on a phone before you publish it.
- 5
Embed it on your website
Copy the embed code from the Embed tab and paste it into your CMS or site editor. The chart appears on your page and updates whenever you edit it.
Make your own interactive seating map
Upload your plan and publish a clickable seating chart today.